
Morphofunctional changes in human bone marrow mesenchymal stem cells during osteogenic differentiation in vitro.
To study the morphofunctional properties of mesenchymal stem cells (MSCs) during osteogenic differentiation in vitro, osteogenic induction was performed using MSCs obtained from 21 patients with long-standing fracture nonunion. The induction was carried out with an osteoinductive culture medium containing dexamethasone, β-glycerophosphate, and L-ascorbic acid. Osteogenic differentiation was assessed by the production of alkaline phosphatase (ALP) and osteopontin (OP) by the cells. Proliferative activity and morphological changes of MSCs during osteogenic differentiation were also studied.
Production of alkaline phosphatase and osteopontin during dexamethasone-induced osteogenic induction of MSCs in vitro (functional changes).
According to various authors, during osteogenic induction activation of ALP and OP genes begins approximately on days 7-9 of incubation of cell cultures with osteoinductive agents. Therefore, ALP and OP detection in osteoinduced cultures was performed from day 4 to day 19 every third day.
Table 1 presents data on changes in ALP production activity by osteoinduced MSCs.
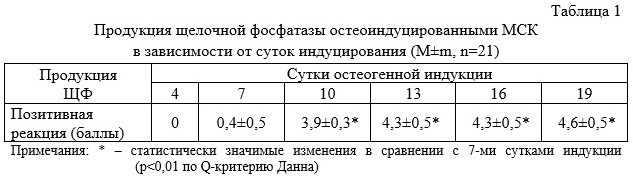
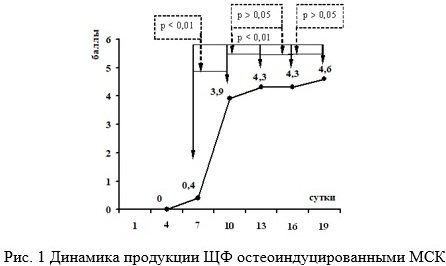
The table shows that ALP production by osteoinduced cells began on day 7. By this time, ALP was produced by 9.5±0.8% of culture cells. During the following days (from day 7 to day 19), ALP production increased statistically significantly and was higher than on day 7 (p<0.01). The greatest «jump» in ALP production activity occurred between days 7 and 10 of induction. By day 10, ALP was produced by 76.2±7.1% of MSCs (p<0.01). By day 13, ALP production was observed in 90.7±6.5% of cells, but there were no statistically significant differences compared with day 10 (p>0.05). During the subsequent days of osteogenic induction (from day 13 to day 19), the number of cells producing ALP remained at the same level (p>0.05) (Fig. 1).
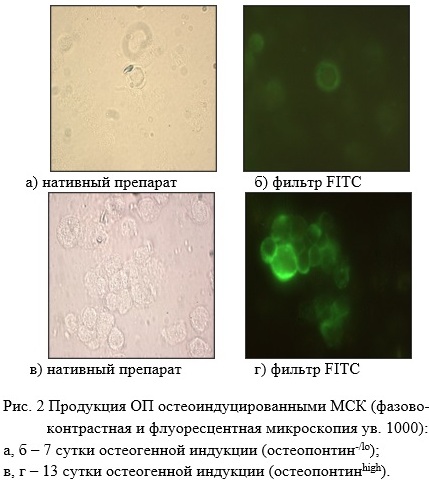
OP production by osteoinduced cells, like ALP production, began on day 7 of induction – by this time OP was produced by 10.5±1.3% of MSCs (Table 2).
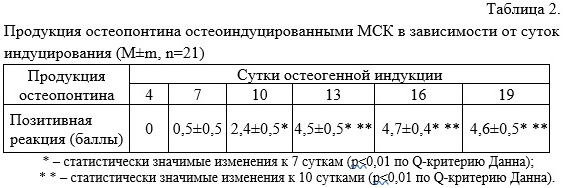
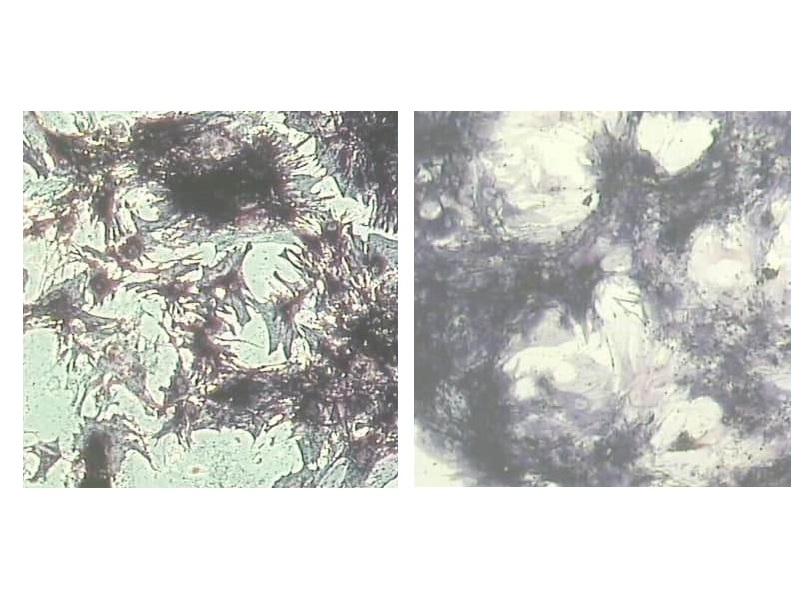
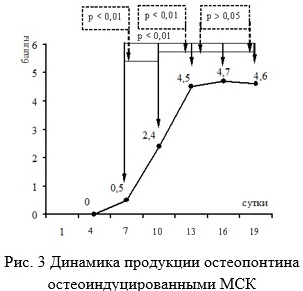
During days 10-19, the number of cells producing OP increased statistically significantly and was higher than on day 7 (p<0.01) (Fig. 4.2a, b). Unlike ALP, however, OP production increased gradually. On day 10, OP was produced by more than 48.5±3.3% of culture cells (p<0.01 compared with day 7), and on day 13 by 91.5±2.5% of culture cells (p<0.01 compared with day 10) (Fig. 2c, d). During days 13-19 of induction, the number of cells producing OP remained unchanged (p>0.05) (Fig. 3).
Morphological changes of MSCs during osteogenic induction in vitro.
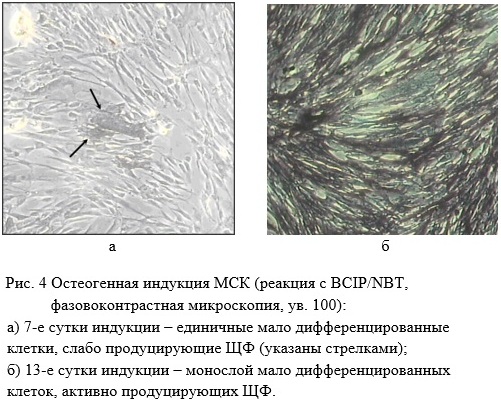
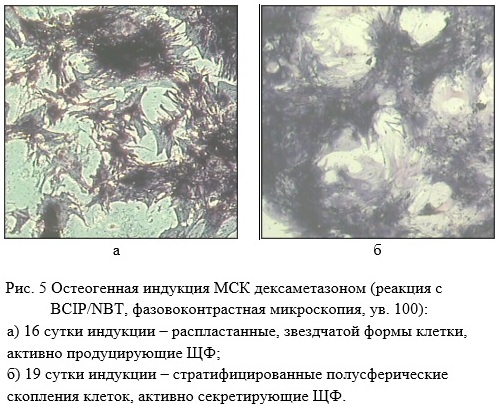
During osteogenic induction, MSCs changed their morphology in addition to actively producing ALP and OP. On day 7, spindle-shaped fibroblast-like undifferentiated cells with single flattened ALP-producing cells were observed in MSC cultures (Fig. 4a). On day 13 of induction, the cells formed a monolayer with parallel low-differentiated spindle-shaped cells (Fig. 4b). By day 16 of induction, the cells flattened and acquired a rounded polygonal shape with pronounced cytoplasmic processes (Fig. 5a). By day 19, the induced cells formed stratified dense hemispherical clusters actively secreting ALP (Fig. 5b).
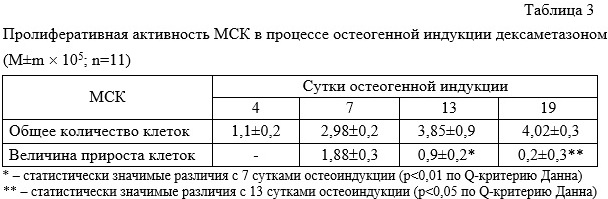
MTT analysis showed that MSC proliferation during osteogenic induction sharply decreased by day 13 and almost completely stopped by day 19 (Table 3).
Thus, during osteogenic induction, MSCs undergo morphofunctional changes. On day 7 of osteogenic induction, MSCs begin producing ALP and OP. By day 13, ALP and OP secretion reaches its maximum and remains at this level throughout the observation period. During osteoinduction, MSCs gradually transform from actively proliferating spindle-shaped and undifferentiated cells into flattened, osteogenically differentiated, non-proliferating cells that form hemispherical clusters.
Morphofunctional changes in human bone marrow mesenchymal stem cells during osteogenic differentiation in vitro.
To study the morphofunctional properties of mesenchymal stem cells (MSCs) during osteogenic differentiation in vitro, osteogenic induction was performed using MSCs obtained from 21 patients with long-standing fracture nonunion. The induction was carried out with an osteoinductive culture medium containing dexamethasone, β-glycerophosphate, and L-ascorbic acid. Osteogenic differentiation was assessed by the production of alkaline phosphatase (ALP) and osteopontin (OP) by the cells. Proliferative activity and morphological changes of MSCs during osteogenic differentiation were also studied.
Production of alkaline phosphatase and osteopontin during dexamethasone-induced osteogenic induction of MSCs in vitro (functional changes).
According to various authors, during osteogenic induction activation of ALP and OP genes begins approximately on days 7-9 of incubation of cell cultures with osteoinductive agents. Therefore, ALP and OP detection in osteoinduced cultures was performed from day 4 to day 19 every third day.
Table 1 presents data on changes in ALP production activity by osteoinduced MSCs.
The table shows that ALP production by osteoinduced cells began on day 7. By this time, ALP was produced by 9.5±0.8% of culture cells. During the following days (from day 7 to day 19), ALP production increased statistically significantly and was higher than on day 7 (p<0.01). The greatest «jump» in ALP production activity occurred between days 7 and 10 of induction. By day 10, ALP was produced by 76.2±7.1% of MSCs (p<0.01). By day 13, ALP production was observed in 90.7±6.5% of cells, but there were no statistically significant differences compared with day 10 (p>0.05). During the subsequent days of osteogenic induction (from day 13 to day 19), the number of cells producing ALP remained at the same level (p>0.05) (Fig. 1).
OP production by osteoinduced cells, like ALP production, began on day 7 of induction – by this time OP was produced by 10.5±1.3% of MSCs (Table 2).
During days 10-19, the number of cells producing OP increased statistically significantly and was higher than on day 7 (p<0.01) (Fig. 4.2a, b). Unlike ALP, however, OP production increased gradually. On day 10, OP was produced by more than 48.5±3.3% of culture cells (p<0.01 compared with day 7), and on day 13 by 91.5±2.5% of culture cells (p<0.01 compared with day 10) (Fig. 2c, d). During days 13-19 of induction, the number of cells producing OP remained unchanged (p>0.05) (Fig. 3).
Morphological changes of MSCs during osteogenic induction in vitro.
During osteogenic induction, MSCs changed their morphology in addition to actively producing ALP and OP. On day 7, spindle-shaped fibroblast-like undifferentiated cells with single flattened ALP-producing cells were observed in MSC cultures (Fig. 4a). On day 13 of induction, the cells formed a monolayer with parallel low-differentiated spindle-shaped cells (Fig. 4b). By day 16 of induction, the cells flattened and acquired a rounded polygonal shape with pronounced cytoplasmic processes (Fig. 5a). By day 19, the induced cells formed stratified dense hemispherical clusters actively secreting ALP (Fig. 5b).
MTT analysis showed that MSC proliferation during osteogenic induction sharply decreased by day 13 and almost completely stopped by day 19 (Table 3).
Thus, during osteogenic induction, MSCs undergo morphofunctional changes. On day 7 of osteogenic induction, MSCs begin producing ALP and OP. By day 13, ALP and OP secretion reaches its maximum and remains at this level throughout the observation period. During osteoinduction, MSCs gradually transform from actively proliferating spindle-shaped and undifferentiated cells into flattened, osteogenically differentiated, non-proliferating cells that form hemispherical clusters.